一、代码的作用
这个代码就是相对于常规的气泡图来说,这个图可能是更好看一些的,气泡图太常规了,而且我觉得气泡图看不出来和什么基因集有关。
二、具体的代码
# 具体的自定义方法可以先自己探索,或者等过段时间,我会写一篇文章详细讲讲怎么用。
# 我的公众号:好想吃帝王蟹
# 我的小红书:LeunHo


# 加载所需要的包
library(clusterProfiler)
library(org.Hs.eg.db)
library(ggplot2)
library(dplyr)
···
# 使用方法:从第10行开始的每一个代码块都是在定义函数,先运行完这几个代码块
# 然后运行setwd('你的文件路径'),再运行create_kegg_circular_plot("你的文件路径/你的文件名.txt")
# 生成的png会保存在这个路径下
···
# 读取输入文件
read_input_file <- function(file_path) {
  lines <- readLines(file_path)
  header <- strsplit(lines[1], "\t")[[1]]
  data <- read.table(file_path, sep="\t", skip=1, header=FALSE, col.names=header)
  return(data)
}

# 将基因symbol转换为Entrez ID
convert_to_entrez <- function(gene_symbols) {
  gene_map <- mapIds(org.Hs.eg.db, keys = gene_symbols, column = "ENTREZID", keytype = "SYMBOL", multiVals = "first")
  return(gene_map)
}

# 将Entrez ID转换为基因symbol
convert_entrez_to_symbols <- function(entrez_ids) {
  symbol_map <- mapIds(org.Hs.eg.db, keys = entrez_ids, column = "SYMBOL", keytype = "ENTREZID", multiVals = "first")
  return(symbol_map)
}

# 进行KEGG富集分析
perform_kegg_enrichment <- function(gene_list) {
  entrez_ids <- convert_to_entrez(gene_list)
  entrez_ids <- entrez_ids[!is.na(entrez_ids)]

  kegg_enrichment <- enrichKEGG(gene = entrez_ids, organism = 'hsa', pvalueCutoff = 0.05, qvalueCutoff = 0.2)

  return(kegg_enrichment)
}

# 生成KEGG环形图
create_kegg_circular_plot <- function(input_file) {
  input_data <- read_input_file(input_file)

  kegg_result <- perform_kegg_enrichment(input_data$gene)

  kegg_df <- as.data.frame(kegg_result)
  kegg_df <- kegg_df[1:min(5, nrow(kegg_df)),]

  color_palette <- c("#8BA6A9", "#A9B7C0", "#C0A9B7", "#B7C0A9", "#A9C0B7")

  png("kegg_circular_plot.png", width = 1400, height = 1400, res = 300)
  par(mar = c(1, 1, 1, 1))
  plot.new()
  plot.window(xlim = c(-1, 1), ylim = c(-1, 1))

  quadraticBezier <- function(x0, y0, x1, y1, x2, y2, n = 100) {
    t <- seq(0, 1, length.out = n)
    x <- (1 - t)^2 * x0 + 2 * (1 - t) * t * x1 + t^2 * x2
    y <- (1 - t)^2 * y0 + 2 * (1 - t) * t * y1 + t^2 * y2
    return(list(x = x, y = y))
  }

  pathway_radius <- 0.42
  gene_radius <- 0.85
  n_paths <- nrow(kegg_df)

  for (i in 1:n_paths) {
    angle <- (i - 0.5) * (2 * pi / n_paths)
    x_center <- pathway_radius * cos(angle)
    y_center <- pathway_radius * sin(angle)

    gene_count <- length(strsplit(kegg_df$geneID[i], "/")[[1]])
    pathway_circle_radius <- 0.07 + 0.005 * gene_count

    symbols(x_center, y_center, circles = pathway_circle_radius, add = TRUE, inches = FALSE, fg = color_palette[i], bg = adjustcolor(color_palette[i], alpha.f = 0.35))

    pathway_name <- kegg_df$Description[i]
    wrapped_name <- paste(strwrap(pathway_name, width = 28), collapse = "\n")
    text(x_center, y_center, labels = wrapped_name, cex = 0.58, col = color_palette[i], font = 2)

    pathway_entrez_ids <- strsplit(kegg_df$geneID[i], "/")[[1]]
    pathway_genes <- convert_entrez_to_symbols(pathway_entrez_ids)

    for (j in 1:length(pathway_genes)) {
      gene_angle <- angle + (j - (length(pathway_genes) + 1) / 2) * (0.5 * pi / length(pathway_genes))
      gene_x <- gene_radius * cos(gene_angle)
      gene_y <- gene_radius * sin(gene_angle)

      gene_circle_radius <- 0.015 + 0.01 * (-log10(kegg_df$p.adjust[i]))
      symbols(gene_x, gene_y, circles = gene_circle_radius, add = TRUE, inches = FALSE, fg = color_palette[i], bg = adjustcolor(color_palette[i], alpha.f = 0.5))

      angle_gene <- atan2(gene_y, gene_x) * 180 / pi
      if (abs(angle_gene) > 90 && abs(angle_gene) < 270) {
        text_srt <- angle_gene + 180
        text_adj <- 1
      } else {
        text_srt <- angle_gene
        text_adj <- 0
      }

      text(gene_x * (1 + 0.02 + gene_circle_radius), gene_y * (1 + 0.02 + gene_circle_radius), labels = pathway_genes[j], cex = 0.4, col = color_palette[i], srt = text_srt, adj = c(text_adj, 0.5))

      control_angle <- (angle + gene_angle) / 2
      control_radius <- (pathway_radius + gene_radius) / 2
      control_x <- control_radius * cos(control_angle)
      control_y <- control_radius * sin(control_angle)

      curve_points <- quadraticBezier(x0 = x_center, y0 = y_center, x1 = control_x, y1 = control_y, x2 = gene_x, y2 = gene_y)

      lines(curve_points$x, curve_points$y, col = color_palette[i], lwd = 0.6, lty = 1)
    }
  }
  dev.off()
}

setwd('F:/生信代码复现/kegg_circularplot') #生成的png会保存在这个路径下
create_kegg_circular_plot("F:/生信代码复现/kegg_circularplot/input.txt") #定义完函数后运行这一行代码
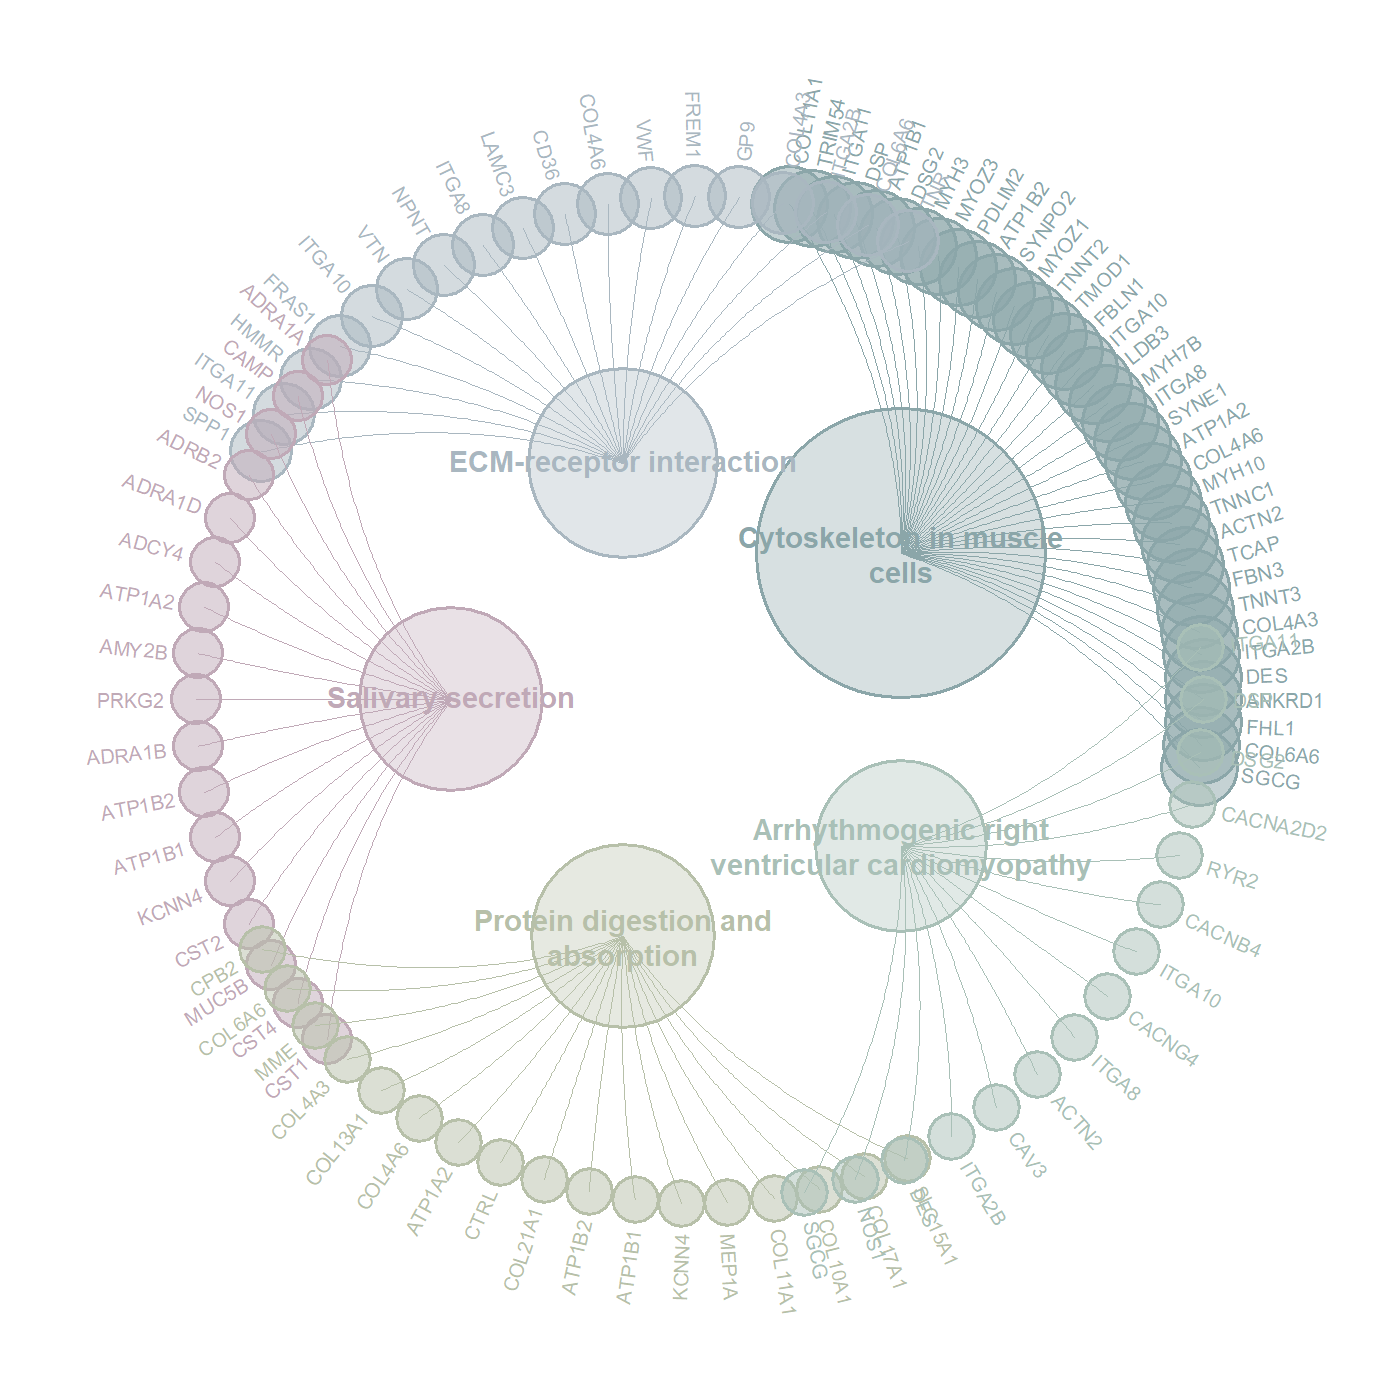
复现出来的图片